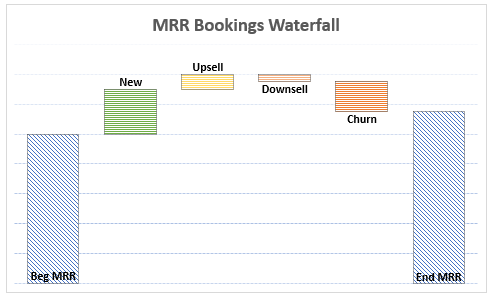
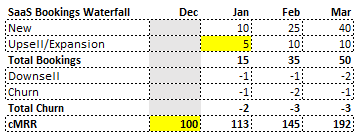
The SaaS Bookings Waterfall is the foundation for key SaaS Metrics. The waterfall is structured by recording monthly booked (contracted) revenue segmented by new, upsell/expansion, downsell, and churn, with the result being net revenue.
Bookings Waterfall by Type:
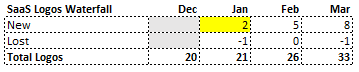
New Logos: Measures new revenue – how quickly and efficiently new business is added
Upsell/Expansion: Measures the revenue growth of current customers – current install base adding new products or seats
Downsell: Measures the partial revenue lost from current customers – current install base cancelling products or seats
Churn: Measures the lost customer revenue – customers leaving the platform
Recording revenue in each of these buckets is necessary in measuring the economics of the customer life-cycle. Too many companies report and measure the business on net revenue and new business, but these views alone do not provide the full picture into how the customer install base evolves.
For example let’s look at two companies both starting with $5M of revenue and growing at 50% year over year to $7.5M. Company A has 4% monthly gross churn versus Company B with 1% monthly gross churn.
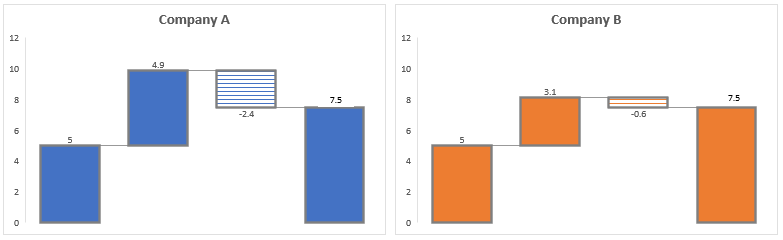
While both companies are growing the business at the same rate, their customer life-cycle evolve at different clips. Company A is adding 58% more new revenue than Company B but losing 300% more revenue to get to the same year end revenue. Because Company A is losing customers at a quicker rate, its customer acquisition cost will increase, putting more pressure on new sales to increase the revenue growth.
Segmenting the revenue types, provides visibility into top line business performance and allows for cohort and trend analysis to dig deeper into answering scenarios such time series or recurring versus anomaly events.
Let’s take a further look at how to summarize the SaaS Bookings Waterfall by revenue and customer, along with the corresponding key SaaS metrics.

SaaS Metrics:
Customer Churn Rate: ∑ Number of Lost Customers in a period ÷ Previous Total Number of Customers
Revenue Churn Rate: ∑ of Lost Customer Revenue in a period ÷ Previous Total Revenue

Revenue Expansion Rate: ∑ of Upsell/Expansion Revenue in a period ÷ Previous Total Revenue
Net Revenue Retention Rate: 1 + Upsell/Expansion Revenue – Churn – Downsell ÷ Total Revenue

Magic Number: ∑ Current Quarter’s New Revenue × 4 ÷ Previous Quarter’s Sales & Marketing Expense

Customer Acquisition Cost (CAC): ∑ Sales & Marketing Expense ÷ ∑ Number of New Customers Acquired
Average Revenue Per Account: Total Revenue in a period ÷ Total Customers in a period

The SaaS metrics below reference equations applied above
Customer Lifetime: 1 ÷ Customer Churn Rate
Customer Lifetime Value (LTV): Avg Rev Per Account (ARPA) × Gross Margin % ÷ Revenue Churn Rate
CAC to LTV Ratio: LTV ÷ CAC
Months to Recover CAC: CAC ÷ ARPA × Gross Margin %
3/15/2020
