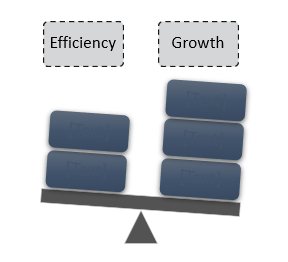
In light of COVID-19, many SaaS companies are dialing back their financial plans to extend cash runway during these volatile economic times. However, despite COVID-19, every company will need to revert to efficiency over growth during their lifecycle whether that’s due to market influence, GTM strategy, liquidity, or what have you. So, the challenge for SaaS CEOs and Finance leaders must address in their business efficiency models are:
What is the right mix of efficiency versus growth?
What efficiency metrics should measure the success of our plan?
How do I put an affective efficiency plan together?
Below are a few guiding efficiency metrics to apply in building an efficient growth plan.
Retention
Gross Dollar Retention: looks at how much MRR is retained from your current customer without upgrades. This ratio is always less than 1 because it does not include upsell or expansion. When measuring your retention rates, make sure to segment customer such as SMB, Midmarket, and Enterprise, because each customer segment has different retention benchmarks – see Bessemer’s 2019 State of Cloud report.
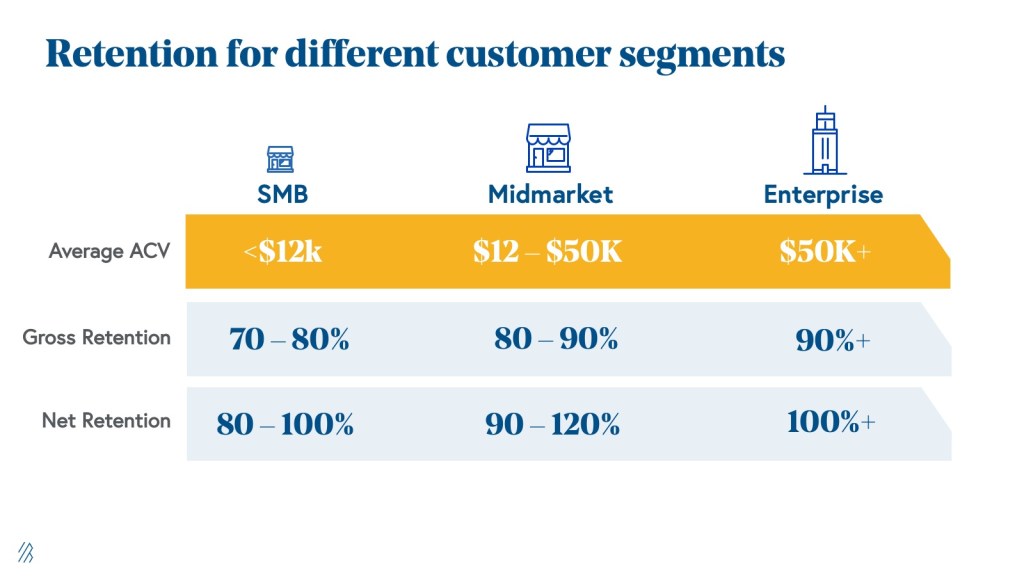
Net Dollar Retention: is similar to gross dollar retention but it includes upsell and expansion revenue. A net dollar retention greater than 1 is the desired goal, because the business is still growing in spite of churn.
The higher the NDR ratio, the more efficient the company can grow. Upselling to current customers is the most capital efficient growth strategy because of there is no customer acquisition cost or lengthy sales cycles that are required for new logos.
Customer Acquisition Cost Payback
CAC Payback: refers to the length in months to recover sales and marketing costs associated with driving new customer logos. CAC Payback is an extremely helpful metric in monitoring the profitability efficiency of the marketing and sales engine.
CAC Payback = Sales & Marketing Expenses in Period / (Net New MRR Acquired in Period * Gross Margin)
For CAC Payback benchmarks, you can refer to Bessemer’s 2017 State of the Cloud Report.
SMB: CAC Payback 3-6 months
Midmarket: CAC Payback 12 months
Enterprise: CAC Payback 18-24 months
CAC Payback Strategies
Hopefully, you have already AB tested different CAC strategies, but continue to experiment to optimize CAC and reduce the payback period.
Customer Segmentation: Segment your customer prospects in order to parse out which ones have to shortest sales cycle potential. SMB customers are the quickest to purchase, but also the quickest to churn. Leverage your customer data to identify SMB profiles who have stayed on your platform the longest, and implement that playbook when selling to the SMB market.
Contract Negotiation: Identify the different types of foreseeable customer negotiations, whether that’s pricing, term length, payment frequency, early outs – and develop a strategy to come to a resolution early in order to reduce the sales cycle time.
Identify the buyer and use case: It goes without saying, but it’s worth noting that reducing the sales cycle time has a much better success rate in identifying early who the decision maker is and what their use case is.
Funnel Optimization: Constantly AB test every part of the sales and marketing funnel to reduce bottlenecks. Optimize the landing pages, push relevant content, leverage engaging chat bots, drive demos, improve SQL conversion by identifying synergies between SDRs and Sales Reps.
Sales Efficiency
The inverse of CAC payback is the Sales Efficiency ratio.
Sales Efficiency Ratio = Net New MRR Acquired in Period * Gross Margin) / Sales & Marketing Expenses in Period
Sales Efficiency is a high level health indicator of sales and marketing investment. For example, an S&M investment in $1 to generate new revenue of $1 is a ratio of 1, which is the desired target, indicating a strong sales efficiency. However, I am cautious in relying on sales efficiency alone because it does not provide any indication of the profitability of the customer. For example, if the sales efficiency ratio is 1, then the sales efficiency ratio tells you the sales and marketing engine is working and to invest more money. However, if the customers churn after one year, then the business model will fail and run out of money because it can’t recoup the customer acquisition cost.
I generally like to use the sales efficiency ratio as a barometer in resource planning. For example, when building a budget for sales and marketing I can solve for the optimal expense amount by leveraging new sales projections. Using the sales efficiency formula target of 95%, assuming new annual sales projections are $5M net of gross margin, then I can start to build a sales and marketing budget of $5.5M.
90% = $5,000,000 / $5,500,000
Rule of 40
The 40% rule is growth rate + profit should add up to 40%. So, if you are growing at 20%, you should be generating a profit of 20%. If you are growing at 40%, you should be generating a 0% profit. If you are growing at 50%, you can lose 10%.
Efficiency Score
The efficiency score is defined by net new ARR over net burn. I always use this metric for resource planning for building sales projections. Bessemer’s 2019 State of Cloud report provides benchmark references, explaining an efficiency score between .5x – 1.5x is a good standard to achieve.
4/20/2020
