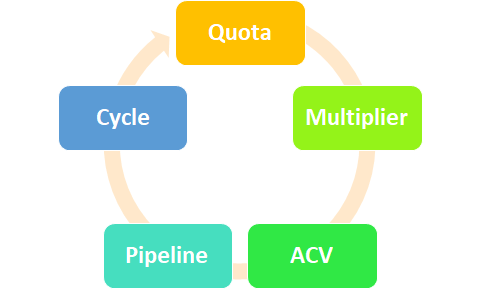
- OTE to Quota Multiple
When benchmarking quota, I like to start with the sales rep’s on target earning (OTE) and multiplying that figure from 3 to 6 to get to a range of multiple quota scenarios. A general benchmark for quota setting, is 4x-6x OTE
When modelling sales quota, whether it is for inside or outside sales reps, a great place to start is running multiple OTE multiplier scenarios to gauge an appropriate quota amount, relative to the company stage, go-to-market, and lead gen strategy. Mapping multiple quota scenarios within the 4x-6x OTE range provide a range that aligns with unit economics.
| Annual OTE | $100,000 |
| Multiple | 6 |
| Annual Quota | $600,000 |
2. ACV to Quota Alignment
Now that you have a barometer for quota, it’s important to then align those quota amounts with your average ACV, keeping in mind how many deals are required to meet quota. For example, a rep with an annual quota of $600K, where ACV is $3K, would require ~16 deals per month. That deal velocity may or may not be too high depending on your sales cycle and go-to-market. Taking ACV into account for quota setting, is a useful tool in understanding your deal velocity. By knowing your company’s sales cycle, will guide you in determining the maximum deals a rep can hit within a timeframe, which would then set the bar for a quota amount.
| ACV | $3,000 |
| Annual Quota | $600,000 |
| Deals per Month | ~16 |
3. Pipeline Coverage
Using the example above, a rep who’s annual quota is $600K, how much pipeline coverage is needed for the year? Generally, this amount depends on the aggregate win rate. In other words, divide the number of wins across the sales team by the sum of the wins and losses, all within the same period. For example, if the sales team won 660 deals within the year and lost 1,340 then the win rate would be 33% (660 / 660+1,340). If your win rate is 33 percent and sales target is $600K, then the pipeline coverage would be $1.8M.
| Win Percentage | 33% |
| Annual Quota | $600,000 |
| Pipeline Coverage | $1,800,000 |
4. Sales Cycle Time
Depending on the number of deals a rep can close per month and how long those deals have been sitting in the pipeline will provide an indication of the sales cycle time. Additionally, understanding your win rate along with the sales cycle time will provide an indicator of how much new pipeline must be generated to fulfill sales targets. A word of caution, if you have free trials, exclude these customers in your analysis.
9/07/2020
